Nowadays, flow cytometry has become a powerful technique to analyze thousands of individual cells or other particles for several parameters within seconds. In flow cytometry analysis, fluorescent dyes are excited by a laser of a certain wavelength and release energy that emits fluorescence of a certain wavelength, so we should pay attention to their excitation and emission wavelengths when selecting fluorescent dyes to choose the right combination of laser and fluorescent dye. With the emergence of multicolor flow cytometry, new fluorescent dyes and labeled antibodies have also been developed significantly. However the emission spectra of fluorescent dyes do not correspond perfectly to the detection channels of the flow cytometer. In most cases, the emission spectrum of a dye often spans multiple detection channels, which can cause interference with signals from other channels. Moreover, the expression level of different proteins and the brightness of the dyes are all different, so if the dyes are not matched properly, it may cause great trouble to data analysis, or even lead to the failure of the experiment because the data cannot be analyzed at all. For each multicolor flow-through assay experiment, designing a reasonable color matching will greatly improve the efficiency of the experiment. Selecting the optimal combination of fluorescent dyes for the antibodies required in an experiment is a complex process. The technical team at Elabscience® has summarized some common fluorescent dyes used in flow-through and multicolor flow-through cells to help you avoid duplicate experiments and mistakes, and increase the success rate of your experiments.
1. Characterization of commonly used fluorescent dyes and detection filters
With the wide variety of fluorescent dyes available, how do you know if they are suitable for the flow cytometer you have and how to compensate between them? This requires a clear understanding of the dyes used and the flow cytometer used for the assay. For multicolor labeling, we usually need to focus on the excitation and emission wavelengths of the dye as well as the parameters of the light sheet in front of the detector. Where the excitation wavelength determines whether the target dye can be excited on a specifically formulated flow cytometer, the emission wavelength and filter parameters determine whether the fluorescence of the dye can be detected on that flow cytometer. In general, dyes with excitation wavelengths near the wavelength of the laser can generally be excited; when the emission wavelength of the dye falls within the detection range of the filter, its fluorescence can be detected by the instrument. Regarding the bandpass filter parameters in the table below, the number before the slash indicates the center wavelength, and the number after the slash indicates the width of the pass-through, such as 525/50, which indicates that the center wavelength is 525 nm and the width of the pass-through is 50 nm, i.e., fluorescence of 500 ~ 550 nm is pass-through with respect to this filter.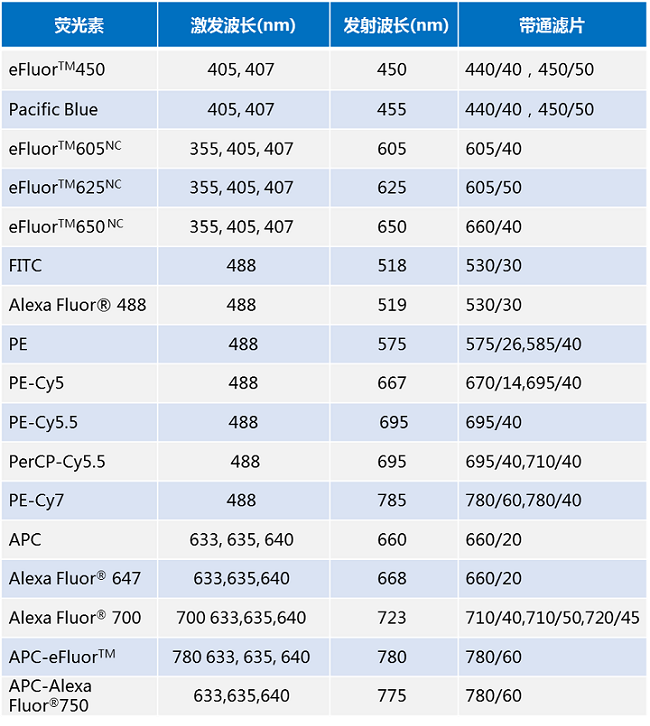
Notes:
a. Take eFluorTM450 as an example: its fluorescence excitation peaks are 405nm and 407nm, and the maximum emission wavelength is 450nm (the maximum excitation wavelength depends on the excitation light of the flow cytometer laser), which requires 440/40 (i.e., the detection wavelength range of 440±20nm) or 450/50 (i.e., the detection wavelength range of 440±25nm) Band Pass (BP). b. Take eFluorTM450 as an example: its fluorescence excitation peaks are 405nm and 407nm, and the maximum emission wavelength is 450nm (the maximum excitation wavelength depends on the excitation light of the flow cytometer laser). b. Use the eFluorTM606 as a band pass filter (BP).
b. Take eFluorTM605NC as an example: its fluorescence excitation peaks are 335nm, 405nm and 407nm, and the maximum emission wavelength is 605nm, which requires 605/40 (i.e., the detection wavelength range is 605± 20nm) band pass filter for flow cytometry detection.
Notes:
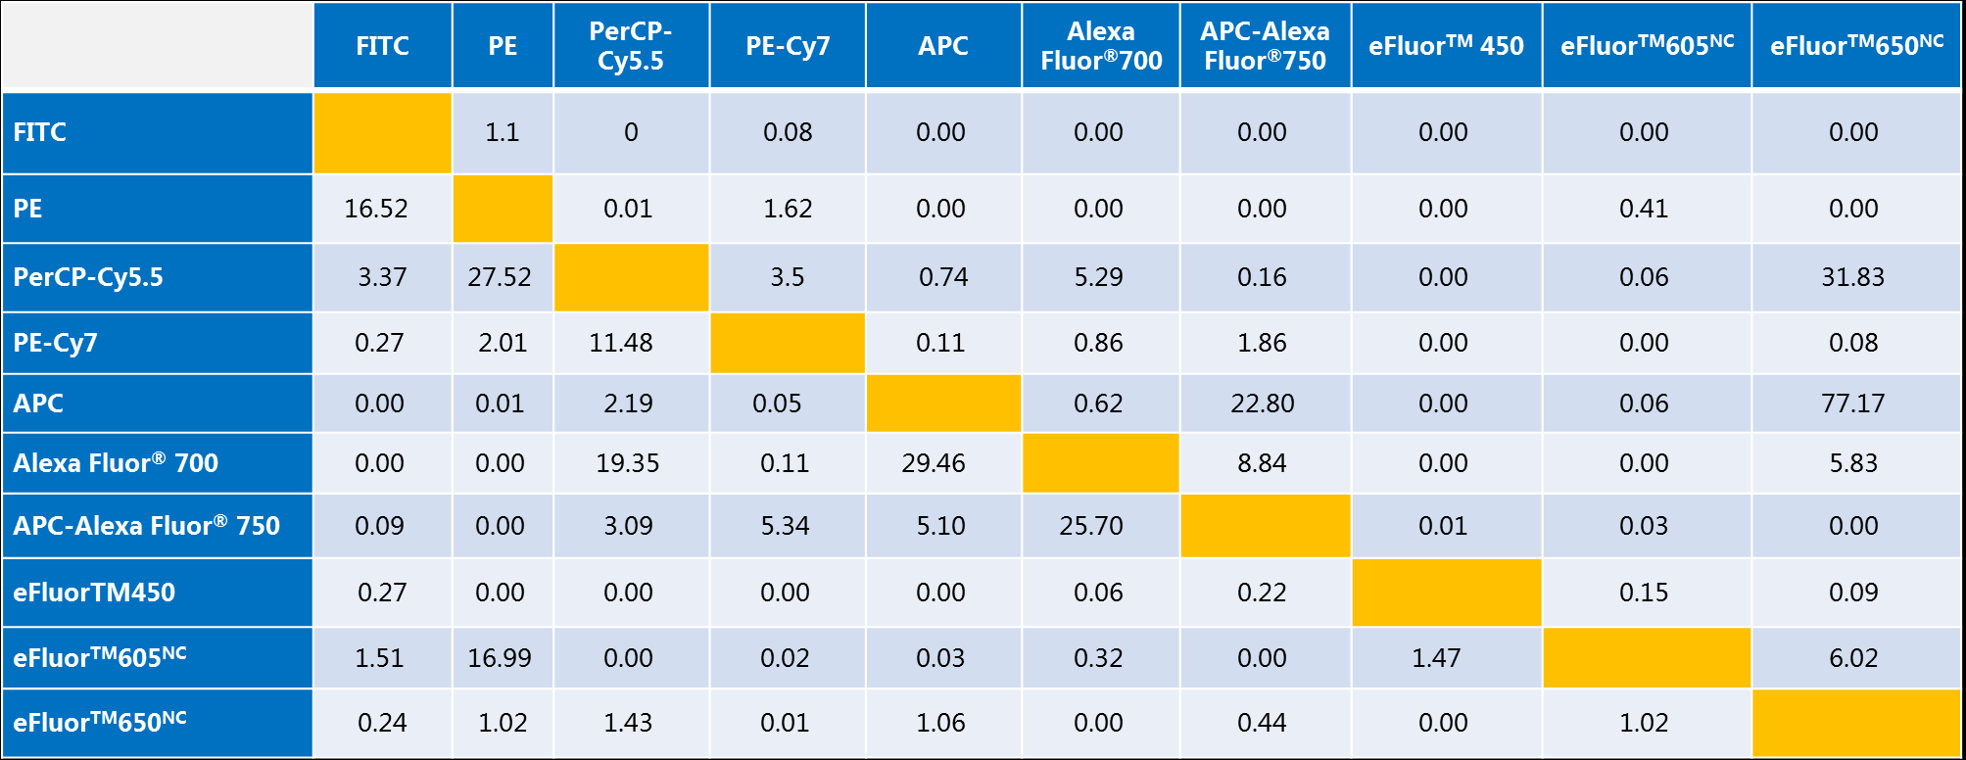
a. The values in the table represent the fluorescence compensation between each fluorescence detection channel in %.
b. Take FITC and PE as an example: if we use FLi-%FLj, that is, the fluorescence compensation value is set when the fluorescence leaked from the jth channel is deducted from the ith channel; then the FL1 channel of the flow cytometer detects FITC, and the FL2 channel detects PE, the compensation of the instrument needs to be set as FL1-%FL2=1.10, FL2-%FL1=16.52. It can be simply understood as follows: 1.10% of the PE fluorescent dye leaks into the PE fluorescent dye, and the compensation value is set to 1.10%, and the compensation value is set to 16.52. Simply understand: 1.10% of PE fluorescent dye leaks into FL1 detection channel, which needs to be subtracted from FL1, while 16.52% of FITC fluorescent dye leaks into FL2 detection channel, which needs to be subtracted from FL2.
2. Brightness comparison of common fluorescent dyes
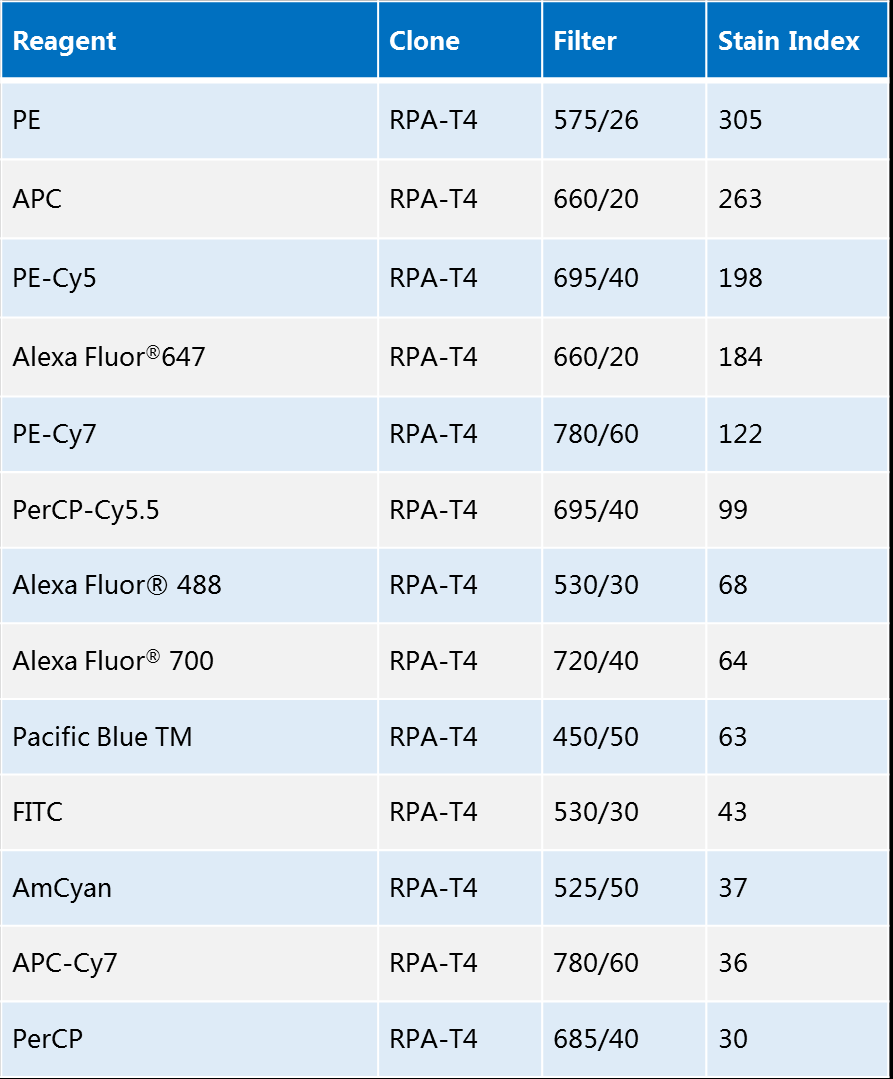
The brightness of fluorescent dyes can be used to compare the fluorescent labeling effect of different fluorescent dyes, as indicated by the relationship between the fluorescent signals of negative and positive cell populations. However, the fluorescence signals of negative cell populations are correlated by several factors such as signal intensity, autofluorescence, non-specific staining, and electronic noise of the instrument. In order to avoid these uncontrollable factors from interfering with the judgment of fluorescent dye brightness, scientists have proposed the concept of Stain Index.
The Stain Index is defined as half of the ratio between the difference between the average fluorescence intensity of the positive cell population and the average fluorescence intensity of the negative cell population and the standard deviation of the fluorescence intensity of the negative cell population. The staining index is only correlated with the antibody clone number and quality, the purity and quality of the fluorophore, the fluorescence modification ratio, the laser line and its power, the long-pass and band-pass filters, and the target cells. Overall, the staining index is positively correlated with the brightness of the fluorescent dye, i.e., the higher the brightness of the fluorescent dye, the higher its staining index, and vice versa.
Therefore, the brightness of common fluorescent dyes can be seen by the staining index: PE > APC > FITC > PerCP.
3. Principles of selecting fluorescent dyes for multicolor flow cytometry
1) Choose the brightest fluorescent dye according to your machine configuration.
Understand the capabilities of the flow cytometer you are using. Most flow cytometers have two or more lasers with five wavelengths to choose from: UV (355 nm), violet (405 nm), blue (488 nm), yellow (561 nm) and red (640 nm). In addition to the laser, the specific light sheet and detector will determine how many colors can be detected simultaneously in your setup.
Multi-color labeled fluorescent dyes should be used with as many different laser excitations as possible. When choosing between fluorescent dyes with the same laser excitation, give preference to dyes with high brightness to ensure the best resolution. Commonly used high brightness dyes include PE, PE/Cyanine5, PE/Cyanine7, APC, AF647, etc. However, it does not mean that a high brightness dye will result in a better signal on your flow cytometer, which also requires that your instrument is equipped with a suitable laser, filter and detector.
2) Balancing antigen expression level and dye fluorescence brightness
In single-color flow-through assays, we usually choose the brightest dyes, such as PE, APC, etc. However, in multi-color flow-through assays, we usually choose the brightest dyes. However, in multicolor flow-through detection, sometimes we have to use some darker dyes because of the color limitation. In order to ensure an acceptable resolution for each channel, we need to reasonably match the antigen and dye. Generally, darker dyes, such as FITC and PerCP, are preferentially assigned to antigens with high expression, while brighter dyes, such as PE, APC, and PE/Cy5, can be assigned to antigens with low expression or higher resolution requirements. The end result of rational color assignment is to make the signals detected by antigens with different expression levels as balanced as possible.
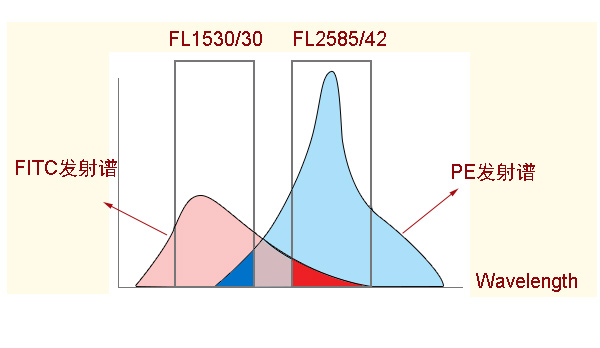
3) Ensure that the overlap of the QC emission spectra of the matching fluorescent dyes is as small as possible.
As mentioned before, when the emission spectra of two fluorescent dyes overlap, their fluorescence signals will interfere with each other, which will bring trouble to data analysis. Although the fluorescence compensation technique can deduct the interference, the larger the compensation value, the more the resolution of the compensated signal will be reduced. It is best to choose fluorescent groups with little or no overlap to minimize this leakage. Different laser-excited dyes are preferred, such as PE and APC, but in some cases this may be in conflict with the rule of choosing as bright a fluorophore as possible. For example, a PE-Cyanine5 labeled antibody would not be paired with an APC labeled antibody when performing a four color analysis. Because the excitation wavelength of Cyanine5 is similar to that of APC, both PE-Cyanine5 and APC can be excited by the red laser (640 nm), and the emission spectra of both are relatively close, resulting in a difficult adjustment of color compensation between PE-Cyanine5 and APC. On the contrary, there is basically no color crosstalk with PE-Cyanine5.5 for APC since the Cyanine5.5 in PE-Cyanine5.5 has an excitation wavelength of 675nm and cannot be excited by red lasers, and there is no interference of Cyanine5.5 with APC. Therefore, it may be necessary to sacrifice the brightness of individual fluorescent dyes to avoid fluorescence bleed-through as well as resolution degradation.
Compensatory adjustments are to be made by single-label control:

So try to choose fluorescent dyes with little spectral overlap, such as FITC/PE-Cyanine7;
Choose fluorescent dyes with different laser excitation, e.g. FITC/APC, PE/APC.
4) Try to avoid false positives from the use of coupled fluorescent dyes
With the increasing number of colors, tandem fluorescent dyes may be used in the experiment. Tandem fluorescent dyes are two dyes connected in series by covalent bonding, where the emission spectrum of one dye partially overlaps with the excitation spectrum of the other, such as PE-Cyanine7 or APC-Cyanine7. Tandem fluorescent dyes are easily degraded and re-decomposed into the original two dyes, resulting in false positives corresponding to the two channels. If using tandem fluorescent dyes, be sure to If tandem fluorescent dyes are used, it is important to complete the experiment as quickly as possible within a short period of time; the longer the exposure time, the more unstable the fluorescent dye becomes. The brightness of the coupled fluorescent dyes may decrease during fixation and permeabilization, so the procedure should be as gentle as possible.
For more information, visit our website: www.aladdinsci.com.